Our Solution
The Judge and the Headlights
No single tool meets all monitoring needs. The most effective approach uses the right tool at the right time. HRMS bookends the monitoring cycle. The biosensor fills it. The Graph Context Engine makes it useful.
The Judge
HRMS
Compliance and forensic validation. HRMS provides legally defensible, high-resolution verification. It unambiguously identifies thousands of individual compounds and differentiates petrogenic NAs from natural background.
Role: The final word. Definitive confirmation that water meets safety criteria.
The Headlights
Luminous Biosensor
Operational monitoring. A panel of whole-cell bacterial biosensors that detect and classify NAs by structural type. Compound-class specificity at operational speed, filling the months-long gaps between HRMS checkpoints.
Role: Data density between compliance events, so operators can see what is happening in time to act.
The Brain
Graph Context Engine
Operational intelligence. A graph-based data platform that correlates NA measurements with operational variables: temperature, pH, flow rates, treatment interventions, seasonal factors. It tells operators not just what happened, but why.
Role: Turns monitoring data into operational decisions.
A Living Measurement
HRMS is an analytical process. It breaks water samples apart and identifies molecular structures. It tells you what compounds are present.
Our biosensor is a living system. Whole-cell bacteria, isolated from Alberta tailings ponds, respond to naphthenic acids the way living organisms in the environment would. They measure bioavailability: not just what is in the water, but what it does to living cells. That is a different kind of data entirely.
Three biosensor panels, each targeting a different class of naphthenic acids, provide a compound-class fingerprint of the water. They detect NAs through a luminescent response proportional to concentration. The bacteria evolved over decades in oil sands process-affected water environments, developing the ability to sense and respond to these compounds. We learned from that capability and engineered it into precision biosensors.
A fourth panel is in active development, targeting direct toxicity through cell membrane damage (narcosis). This would provide a toxicity signal that HRMS cannot capture: not just what molecules are present, but what biological effect they produce. This is an active area of research, not a current capability.
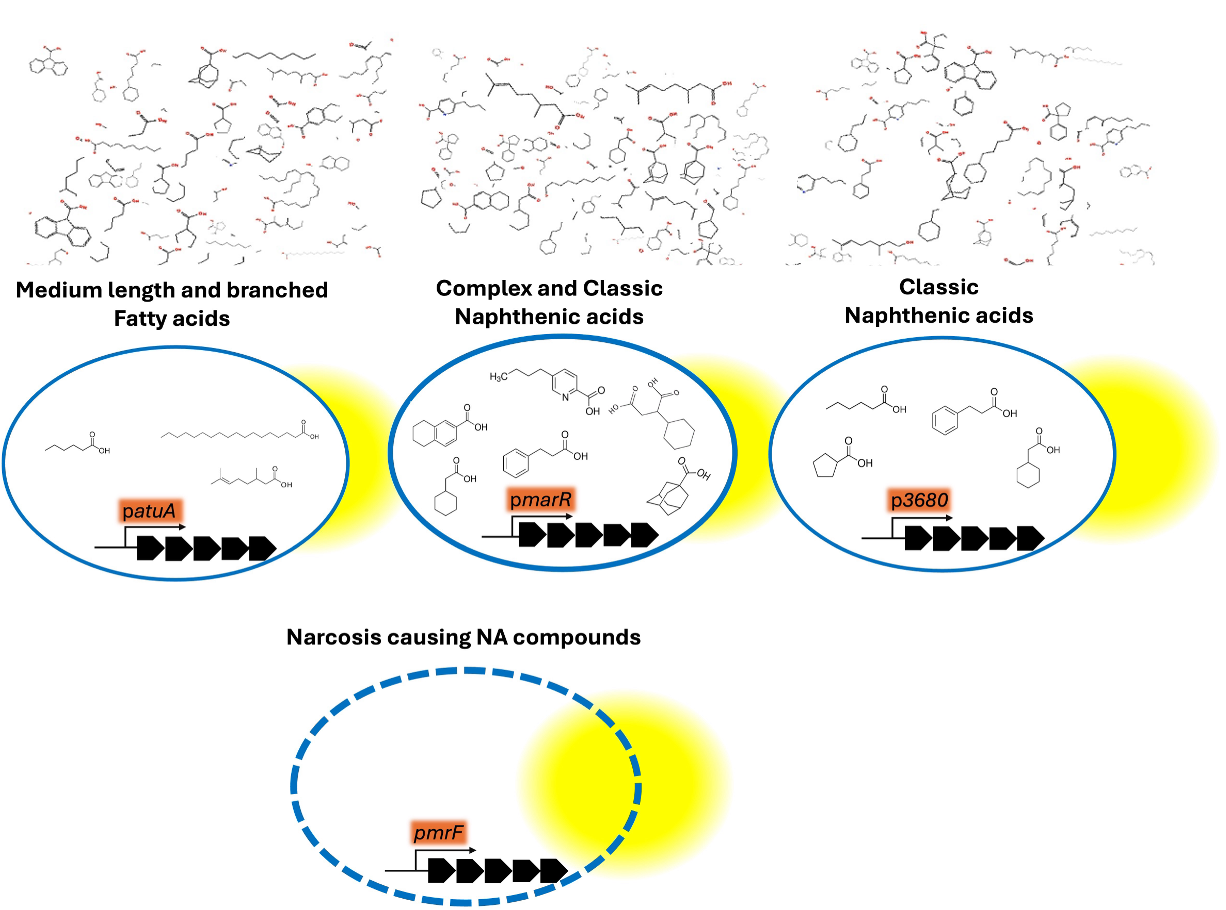
Biosensor panels producing luminescent signal proportional to NA concentration.
Safety and Environmental Integrity
All biosensor testing occurs off-site in controlled laboratory environments. No engineered bacteria are ever introduced into wetlands, pit lakes, or tailings ponds. Samples are sent to the lab for analysis. The technology remains entirely separate from the field environment.
The Graph Context Engine
The data platform that stores relationships, not just data points.
Oil sands operators track dozens of variables across their water systems: NA concentrations, flow rates, temperature, chemical dosing, equipment performance, seasonal patterns. Today, that data sits in separate spreadsheets, PDF reports, and disconnected databases.
A traditional database stores data in rows and columns. It can tell you what each measurement was. The Graph Context Engine stores relationships. It maps how variables connect to each other and how those connections change over time.
When the biosensor flags rising NA concentrations, the GCE can trace the chain: which upstream variables shifted, what historical patterns match, and what happened the last time this combination occurred. The relationships between variables are the insight. A spreadsheet stores numbers. The GCE stores the connections between them.
This is deterministic intelligence, not speculative AI. The GCE maps physical cause-and-effect relationships in water systems using structured, high-frequency data. Operators can interrogate it in plain language and get correlated answers grounded in the data.
One platform with tailored views for each audience. Operators get operational intelligence. Regulators get lifecycle visibility. Communities get transparent access to the same underlying data. One truth, different views.
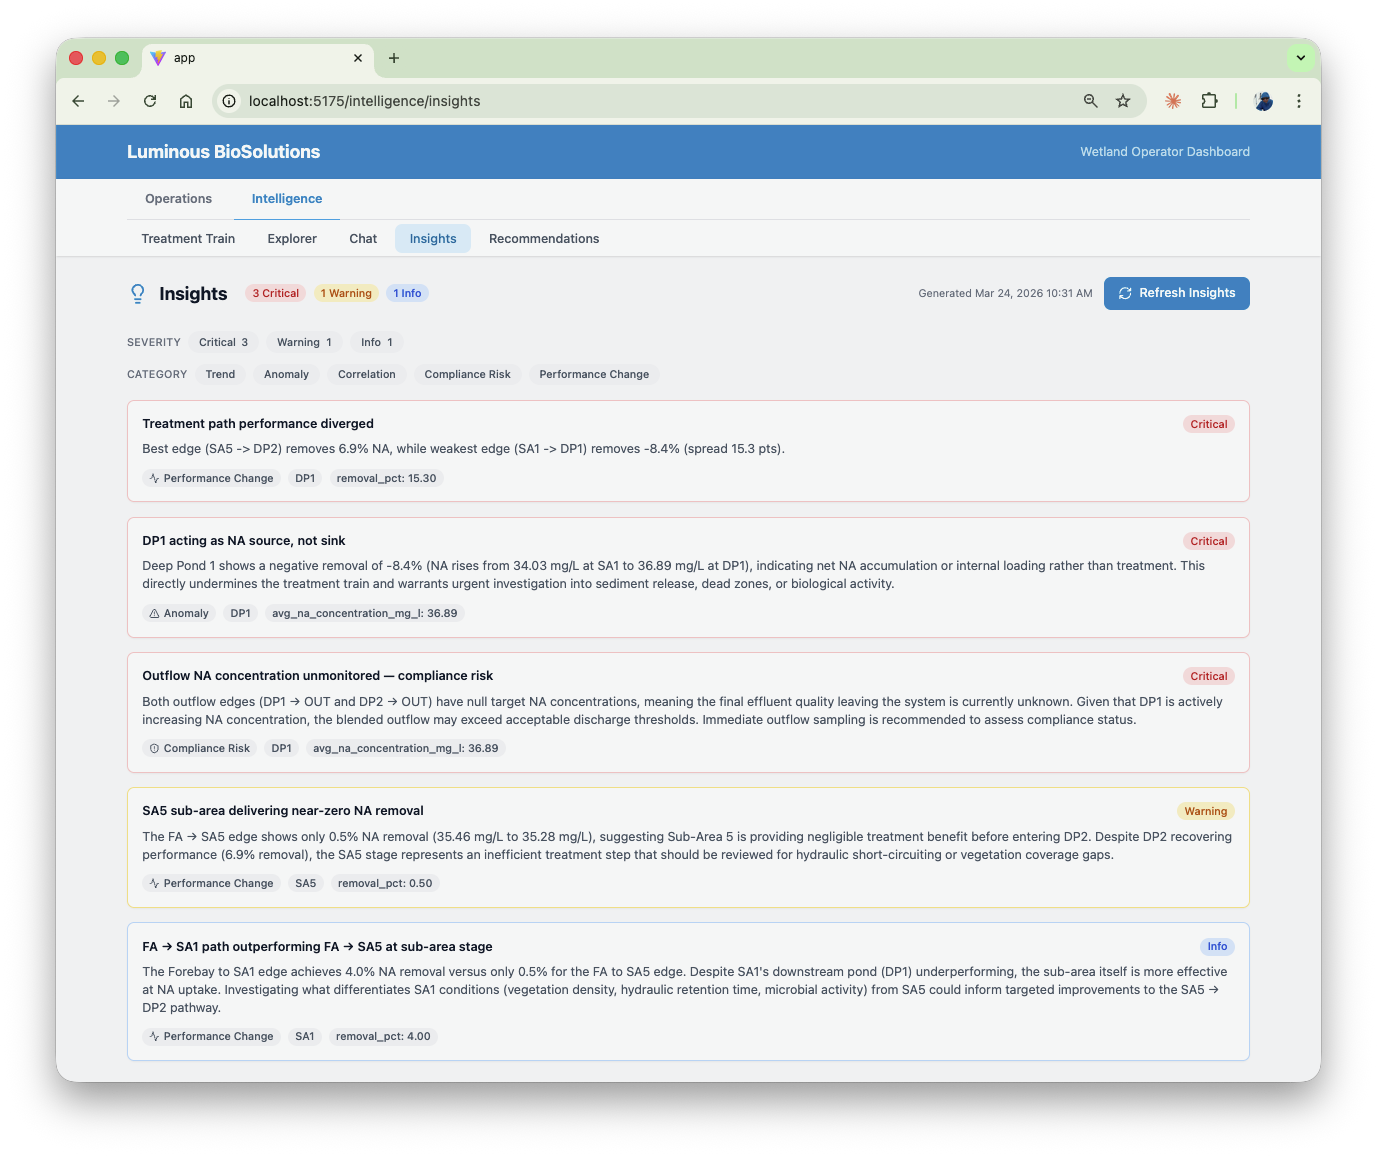
GCE insights view. Actual product screenshot.
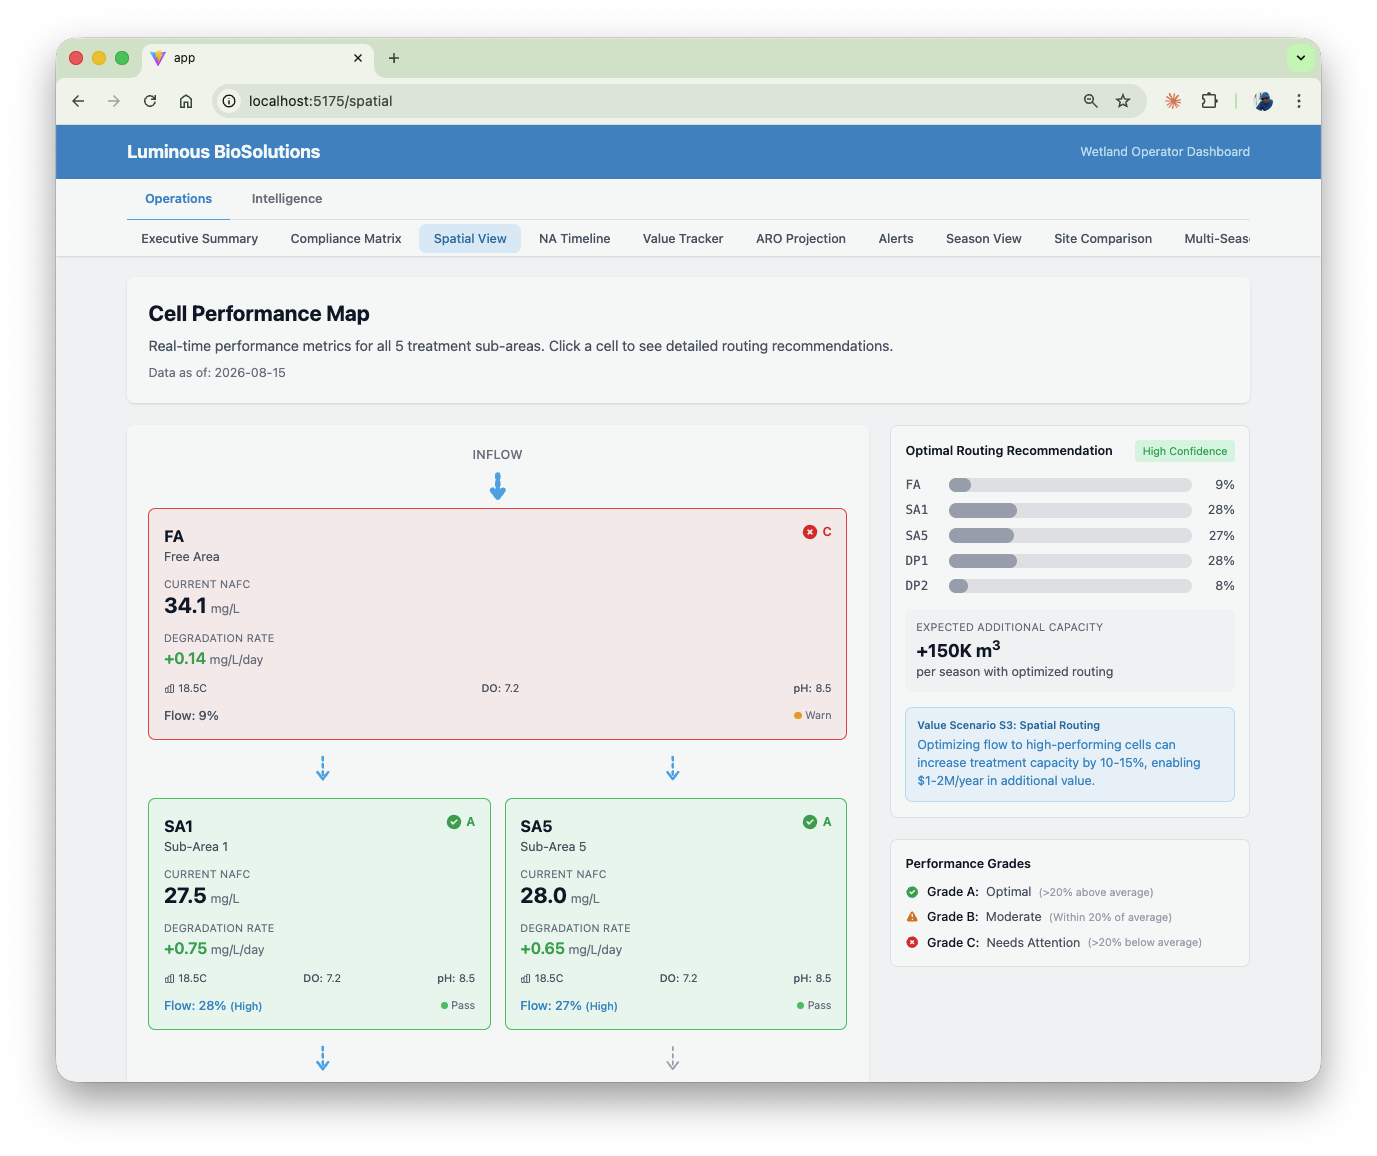
GCE spatial view. Treatment cell performance at a glance.
Subscription, Not Per-Test
The economics should incentivize more monitoring, not less.
The Problem with Per-Test Pricing
Every data point is a cost decision
When each test costs $800 to $1,000+, operators manage costs by reducing sample frequency. The result is sparse data that sits in spreadsheets, disconnected from the operational variables it should be correlated against. The cheaper option is always to test less. The economics work against the monitoring goal.
The Luminous Subscription Model
Fixed cost. Unlimited testing. No data rationing.
Operators pay a fixed subscription cost and are incentivized to test more. More data means better correlations. More correlations mean better decisions. The subscription includes biosensor analysis, GCE dashboard access, and correlated operational intelligence. Results delivered on a live dashboard, not in a PDF.
Zero-Friction Entry
Operations teams ship samples to the Luminous lab in Calgary. We return classified NA data and correlated operational intelligence through the GCE platform. No capital investment. No IT integration. No site access permits. No disruption to existing operations. Start with a single treatment system or process stream. Expand as the data demonstrates value.
See It in Context
The solution is built for operators making daily decisions. See the operational value it delivers.