For Operators
You manage water volumes the size of a city. You deserve data that keeps up, and tells you why things are changing.
You recycle 80 to 90 percent of your process water. Every cycle concentrates naphthenic acids further. The biosensor tells you what those NAs are doing to living cells. The Graph Context Engine tells you why, by connecting that data with everything else in your operation. Answers in days, not months.
You already track flow rates, dosing, pH, temperature, and equipment performance across your operation. That data sits in SCADA, consultant reports, spreadsheets, and departmental databases. When something changes in your water, there is no practical way to ask what else changed at the same time.
The biosensor + GCE platform connects it. The biosensor classifies NAs by compound type in 24 to 72 hours. The GCE maps those results against your operational variables. When NA levels shift, you see that flow rates changed two days earlier, pH dropped upstream, and the same pattern occurred last season.
Every season the picture gets sharper. Year two is smarter than year one. The system learns your operation because it stores relationships, not just measurements.
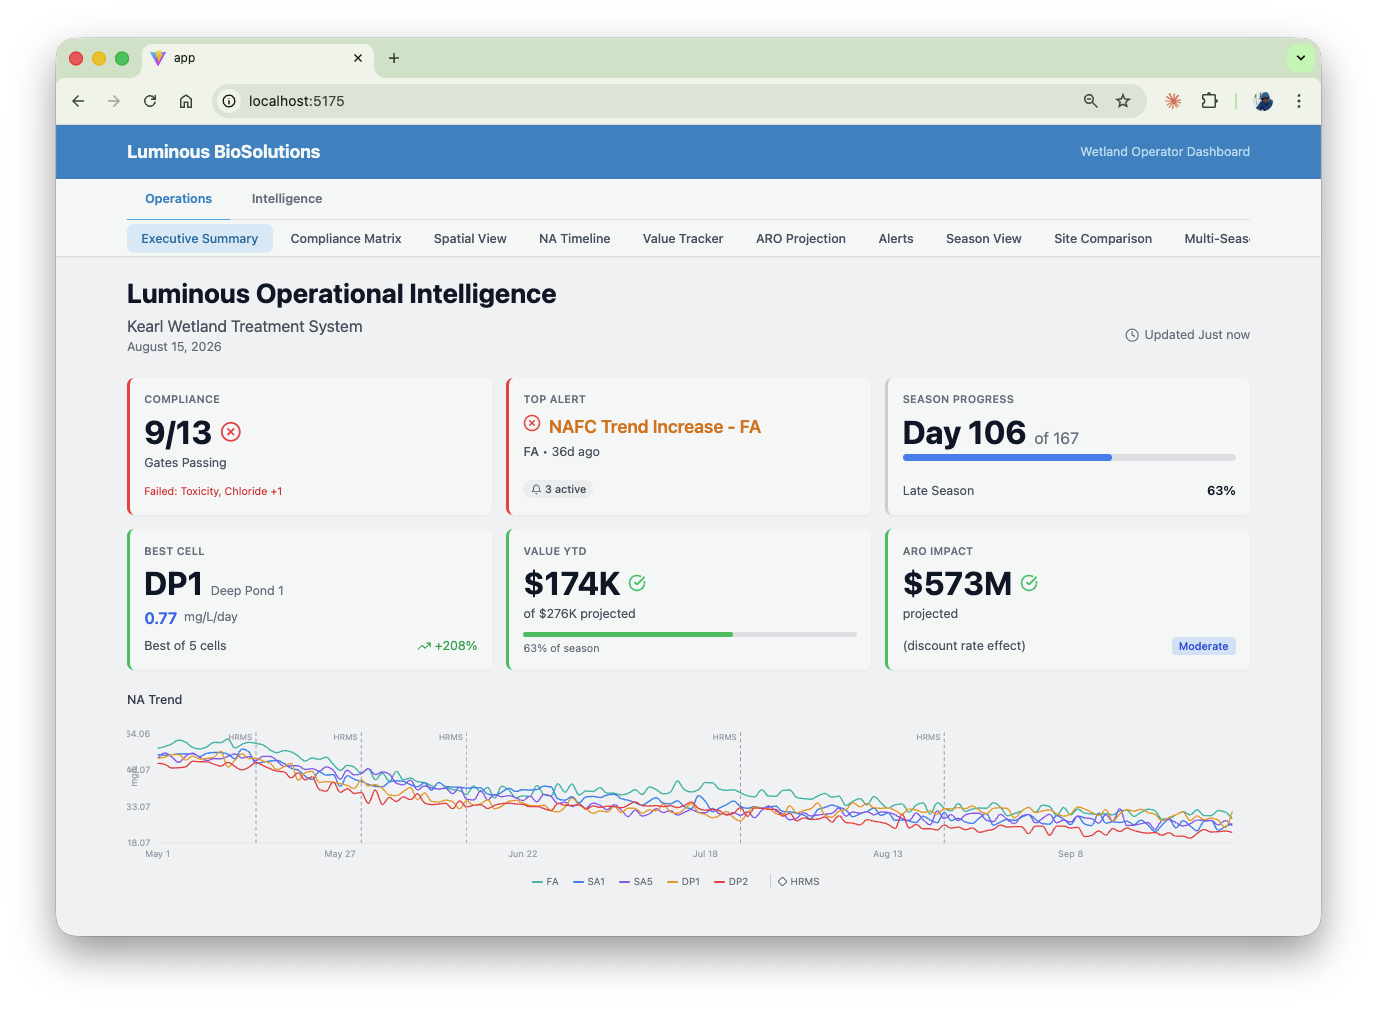
Executive summary. All variables, one view. Not a mockup.
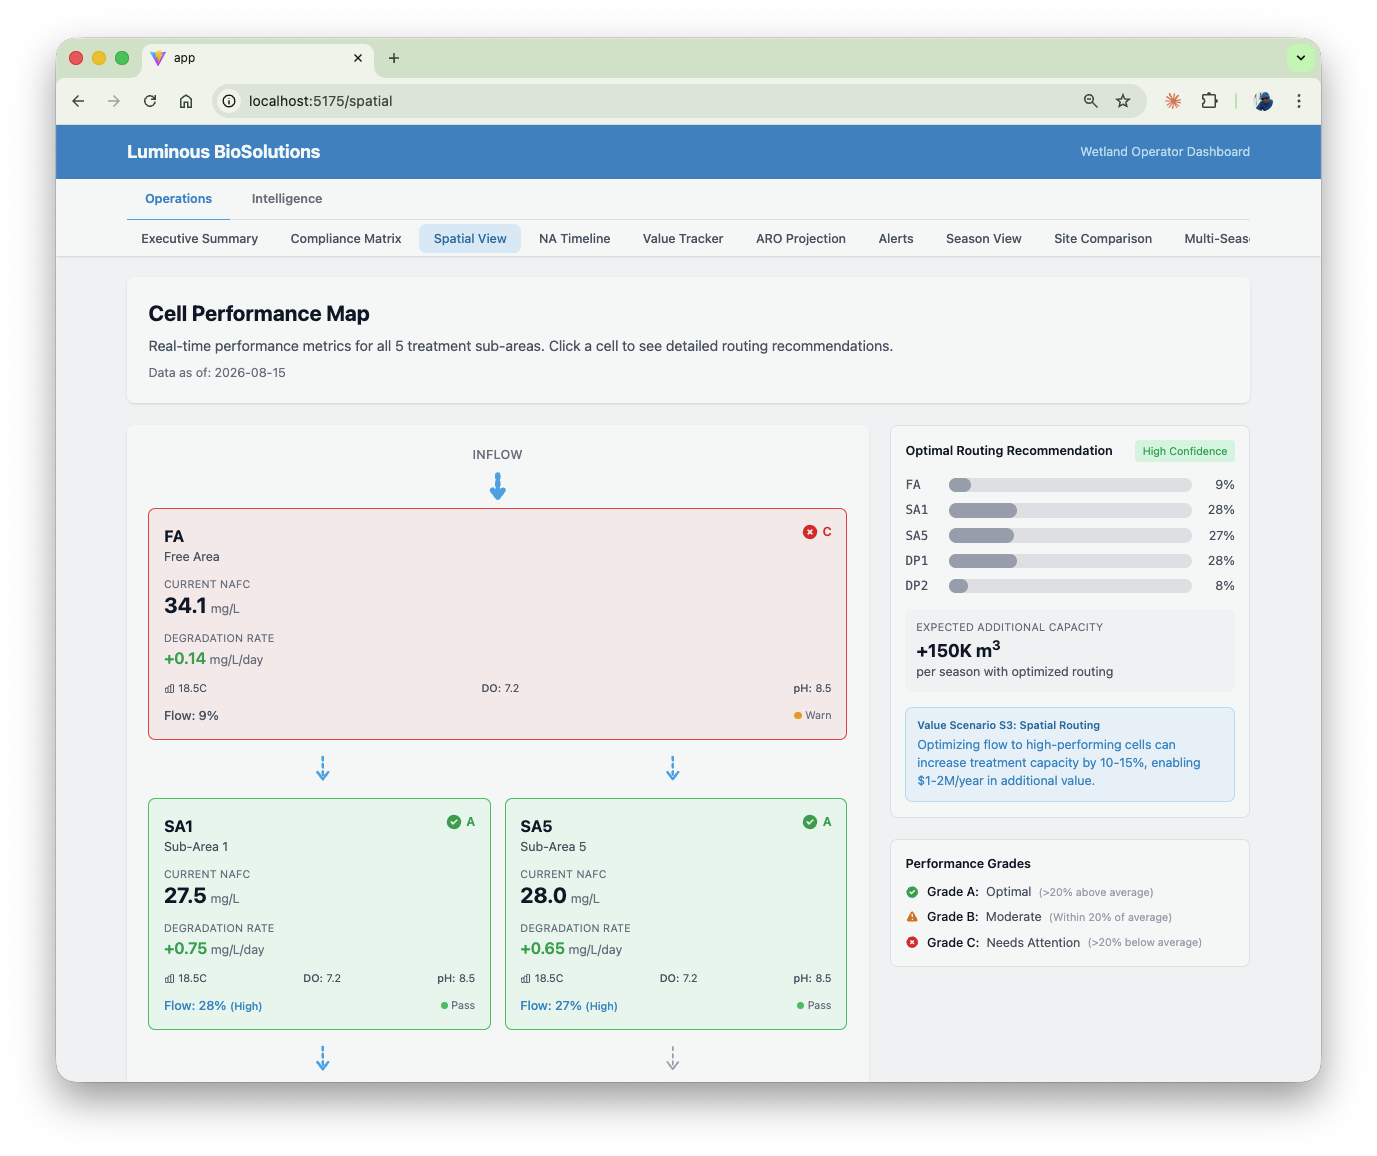
Spatial view. Every treatment system, every variable, connected.
What This Looks Like Day-to-Day
A sample collected Tuesday. Classified data and operational intelligence by Thursday. A decision by Friday.
Tuesday: Sample Collection
Operations team collects water samples from treatment cells or process streams on a daily or 48-hour cadence.
Wednesday: Arrives in Calgary
Samples ship to the Luminous lab. Standard shipping. No special handling. No permits.
Thursday: Biosensor + GCE Delivers
Three biosensor panels classify NAs by compound type in 24 to 72 hours. The GCE maps those results against the recovery dip your plant saw Tuesday afternoon and flags that the same thing happened last September, along with what resolved it.
Friday: Engineer Adjusts
Your process engineer adjusts chemical dosing for the next ore block based on current data and context, not last month’s lab result.
Water Treatment and Remediation
Every week of optimized treatment is water volume moved toward release readiness. Every week of undetected underperformance is a week wasted.
Treatment Cell Performance
An underperforming cell can run all season undetected when HRMS takes weeks. Biosensor data arrives in 24 to 72 hours. The GCE checks it against history, so you know whether a drop in Cell 3 is new or something that resolved with a flow adjustment last August.
“Cell 3 NA removal has dropped 30% over 10 days. Similar pattern in 2024, resolved by reducing flow 20%. Cell 4 has capacity.”
Treatment Season Optimization
Biological treatment is temperature-dependent and the window is finite. The biosensor gives you data across the whole season. The GCE maps treatment effectiveness against temperature and patterns from previous years, so you manage the season with evidence, not the calendar.
HRMS as Planned Validation
At $800 to $1,000+ per HRMS test and weeks of turnaround, every order is a cost and a decision delayed. Continuous biosensor + GCE monitoring gives you confidence between HRMS events. HRMS becomes planned validation, not an emergency response.
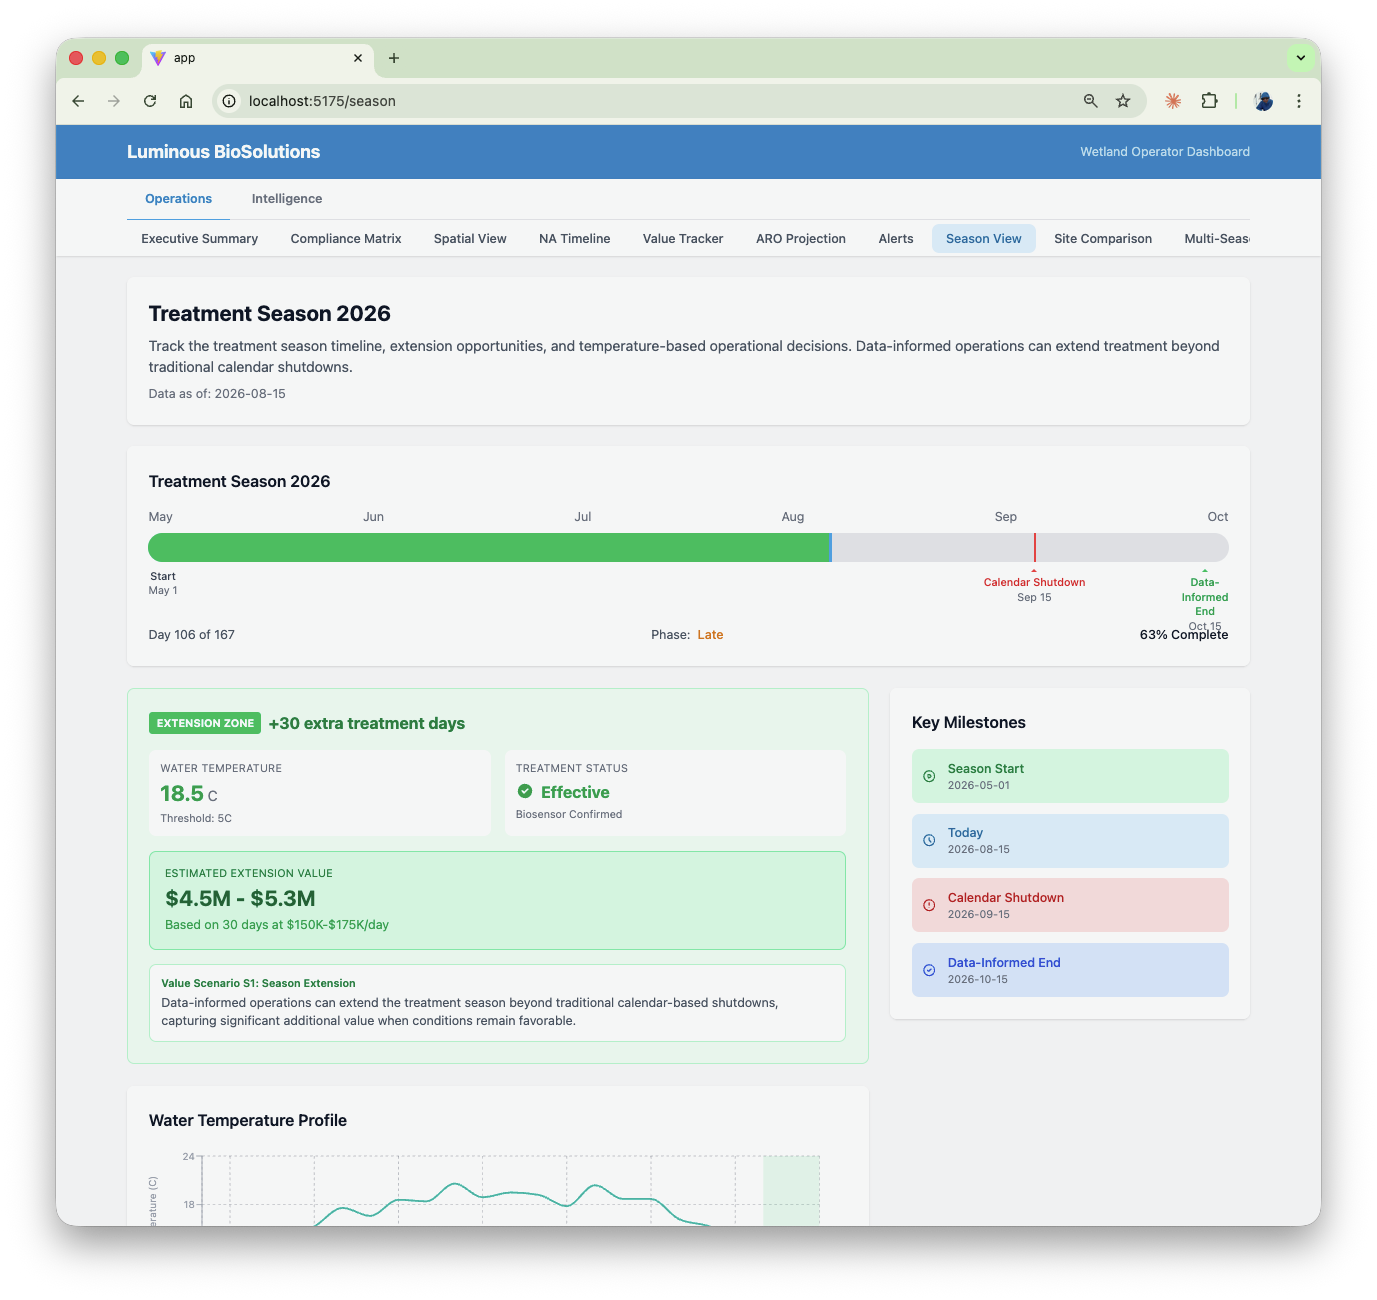
GCE season view. Treatment effectiveness correlated with temperature.
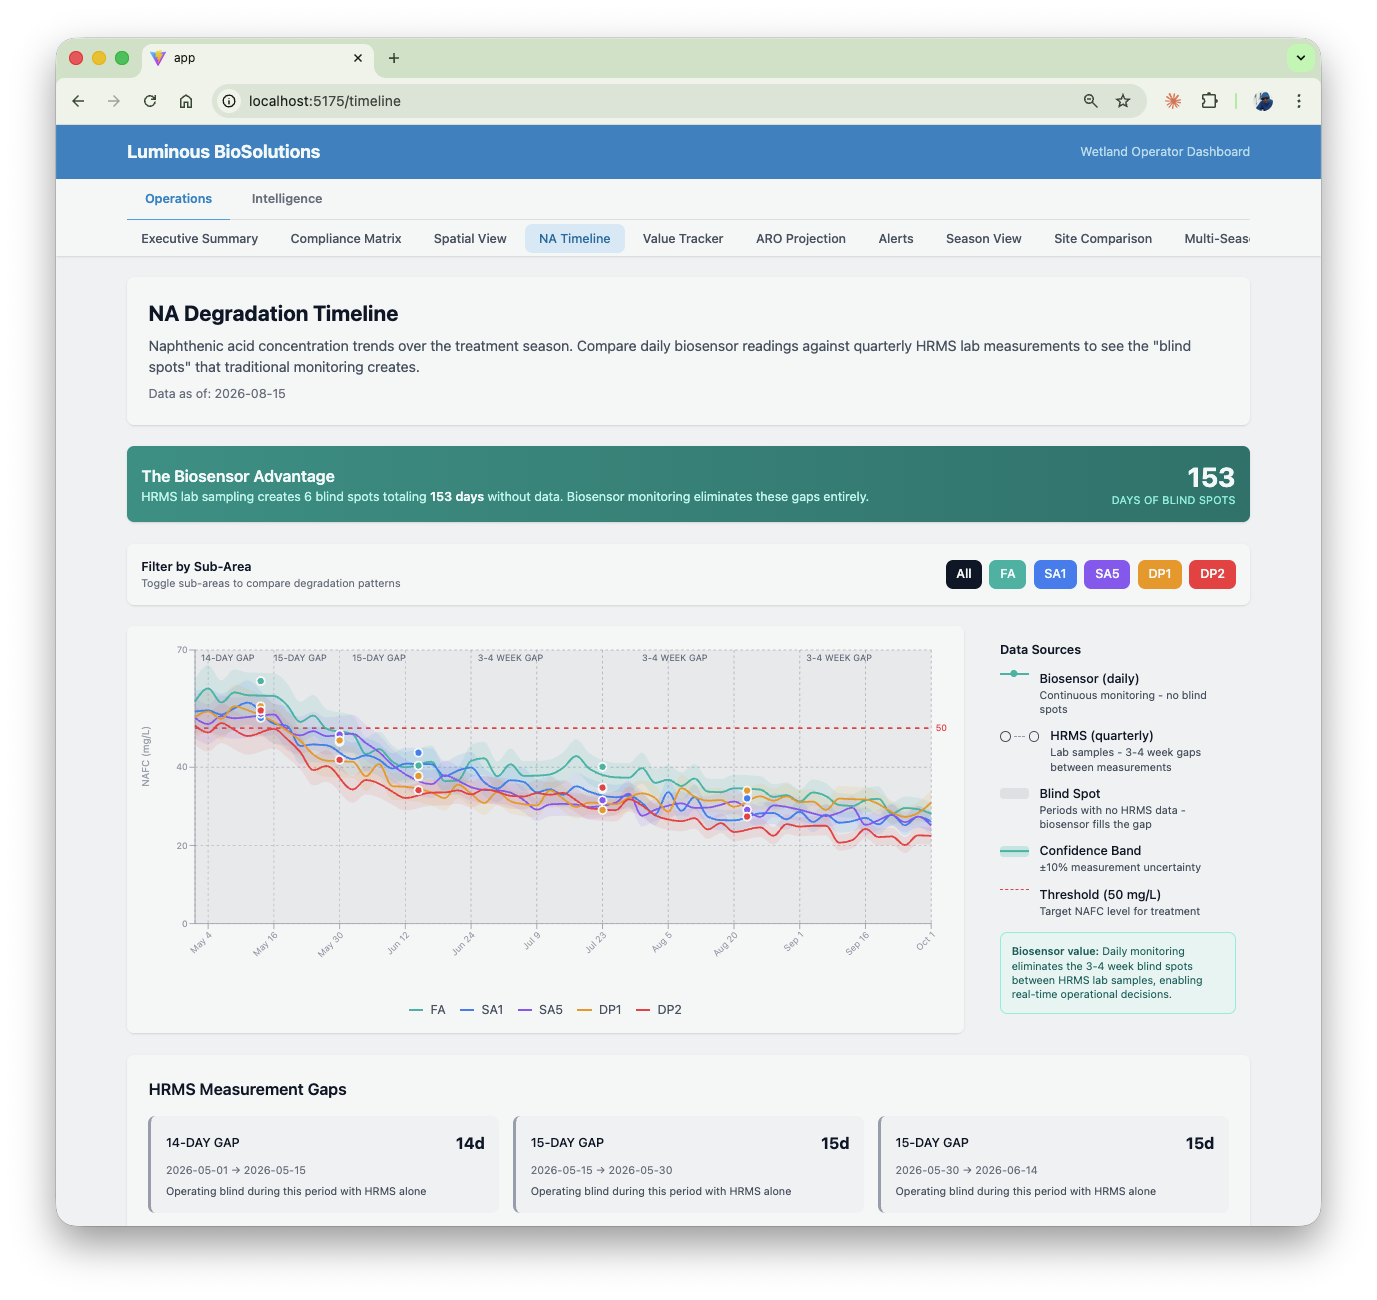
NA degradation timeline. Compound-class trends over the season.
In-Line Process Water
NA concentrations in the recycled water loop range from 40 to 120 mg/L. That number climbs with every cycle. The platform tracks the impact across your entire process.
Bitumen Recovery
Degraded recycled water reduces flotation efficiency. The GCE connects water quality trends with extraction performance so you see leading indicators before recovery drops.
Chemical Dosing
Caustic, demulsifier, and flocculant dosing depend on water chemistry that shifts every cycle. Connecting biosensor data with dose rates and downstream results replaces guesswork with evidence.
Equipment Protection
NAs attack heat exchangers, piping, and coalescers. Tracking concentration trends against maintenance history flags corrosion risk before failure.
Froth Treatment
Accumulated NAs impede separation. The platform flags upstream water quality shifts before froth throughput drops.
Polymer Performance
Degraded recycled water produces harder tailings, which produce worse recycled water. A compounding loop you need to see early, before carryover reaches the extraction circuit.
Water Balance
The Lower Athabasca framework restricts freshwater withdrawals, and winter caps tighten further. Tracking recycled water quality alongside allotments keeps you ahead of compliance.
The Kearl Proof Point
Biosensor + GCE deployed alongside HRMS over a full treatment season.
During the 2024-2025 treatment season at Imperial Oil’s Kearl GROW Engineered Wetland, the platform ran alongside HRMS. The biosensor flagged treatment performance changes weeks before HRMS confirmed the same trends. The GCE connected those signals with operational data to show what was driving them.
Season Extension
Biosensor + temperature data identified treatment windows that periodic HRMS sampling could not resolve.
Flow Routing
The GCE surfaced performance differences between treatment cells, supporting routing decisions with evidence.
Fewer HRMS Tests
Continuous monitoring reduced the need for supplementary HRMS by providing reliable trend data between compliance samples.
Field-validated at Imperial Oil’s Kearl GROW Engineered Wetland. Full treatment season. Strong HRMS correlation. Peer-reviewed: ACS Synthetic Biology, September 2024. TRL 8.
Start with Your Samples
Ship us samples. We return classified NA data and correlated operational intelligence through the GCE dashboard. No capital investment. No IT integration. No disruption.