A biosensor that measures biological effect. A data platform that correlates it with everything else.
Published in ACS Synthetic Biology. Field-validated at Kearl. Patent-pending. The biosensor and Graph Context Engine together create a monitoring and intelligence capability that has not existed in oil sands water management.
HRMS is the gold standard for identifying naphthenic acids. It will remain the compliance tool. But it takes weeks to months, and it only tells you what molecules are present. It cannot tell you what they are doing to living systems, or why the composition is changing.
The Luminous platform answers the questions HRMS cannot. The biosensor measures biological effect in 24 to 72 hours. The Graph Context Engine connects that data with your operational variables: flow, pH, temperature, dosing, seasonal patterns. Three questions, answered together: What is in the water? What is it doing? And why is it changing?
Two Different Questions About the Same Water
HRMS
What is in the water?
Identifies molecular structure and composition. Distinguishes thousands of individual NAs. Differentiates petrogenic from natural background. The gold standard for compound identification. Results in weeks to months.
Periodic snapshots. Molecular identity.
Luminous Biosensor + GCE
What is the water doing, and why?
Whole-cell bacteria isolated from Alberta tailings ponds measure biological effect. The GCE connects that data with operational variables across the treatment system. Results in 24 to 72 hours. Continuous. Connected. Compounding over seasons.
Continuous biological data. Operational context.
Four Panels. Four Signals. One Fingerprint.
Each panel uses whole-cell bacteria that glow when they detect specific NA types. Run them together and you get a compound-class fingerprint of the water. The GCE puts that fingerprint in context.
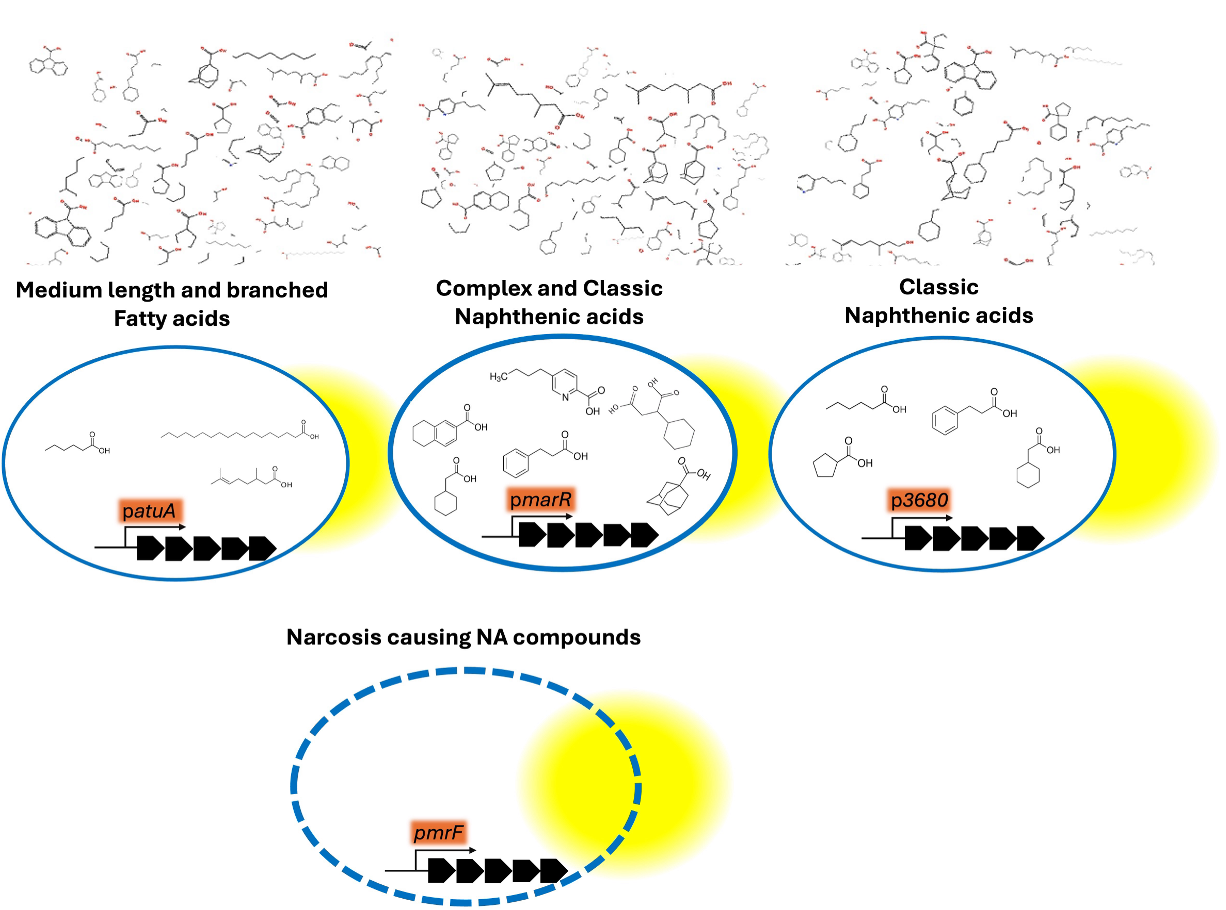
Biosensor panel architecture. Three active panels (solid) and the narcosis toxicity panel in development (dashed). Yellow glow represents luminescent gene expression.
Panel 1
atuA: Straight-Chain NAs
Detects the simplest NA structures: open chains and linear forms. When these molecules contact the bacterial cell membrane, they activate the atuA gene and the cell produces light. More NAs, brighter glow. Proportional to concentration.
Panel 2
marR: Complex and Aromatic NAs
Detects the multi-ring, aromatic NAs that are most abundant in oil sands process water. These are the structures that make OSPW chemically distinct. The bacteria respond through a different pathway (marR), producing a signal separate from Panel 1.
Panel 3
3680: Classical Cyclic NAs
Detects ring-shaped NAs built from cyclopentane and cyclohexane structures. These cyclic forms activate a third bacterial pathway, giving an independent signal that helps distinguish between NA classes when all three panels run together.
Panel 4 · In Development
Narcosis: Direct Toxicity
Measures whether the water is causing cell membrane damage. The first three panels identify which NA types are present. This one measures whether they are causing biological harm. Combined with the others through the GCE, you could see which NA classes are driving the damage.
Why Biology, Not Chemistry
Every panel uses the same core science. NAs interact with the bacterial cell membrane and trigger specific genes that produce measurable light. These bacteria evolved their sensitivity over decades in Alberta tailings ponds, which is why they can distinguish NAs from other organics like humic and fulvic acids that confuse bulk methods like FTIR.
Run all panels together and you get a compound-class fingerprint. Feed that into the GCE alongside HRMS results and operational data, and the fingerprint gains context. Not just what the water is doing biologically, but what else in the system connects to those changes.
From Measurement to Understanding
The biosensor creates the data. The Graph Context Engine makes it useful.
The GCE stores relationships between variables, not rows and columns. It maps how those relationships change over time. That means you can ask questions that have never been answerable in oil sands water science:
At what temperature threshold does biological degradation of cyclic NAs drop off? Does a flow rate change upstream predict a composition shift downstream two weeks later? Did the pattern you are seeing right now happen last September, and what resolved it?
With HRMS alone, you get a handful of snapshots per season. The biosensor generates dozens of data points per treatment system. The GCE connects each one to operational context: flow, pH, temperature, dosing, equipment state. Every season the picture gets sharper. Season three is smarter than season one, because the data compounds.
For a scientist, this is the dataset that has not existed. Cause-and-effect relationships in oil sands water treatment, studied at the timescale those systems actually operate on.
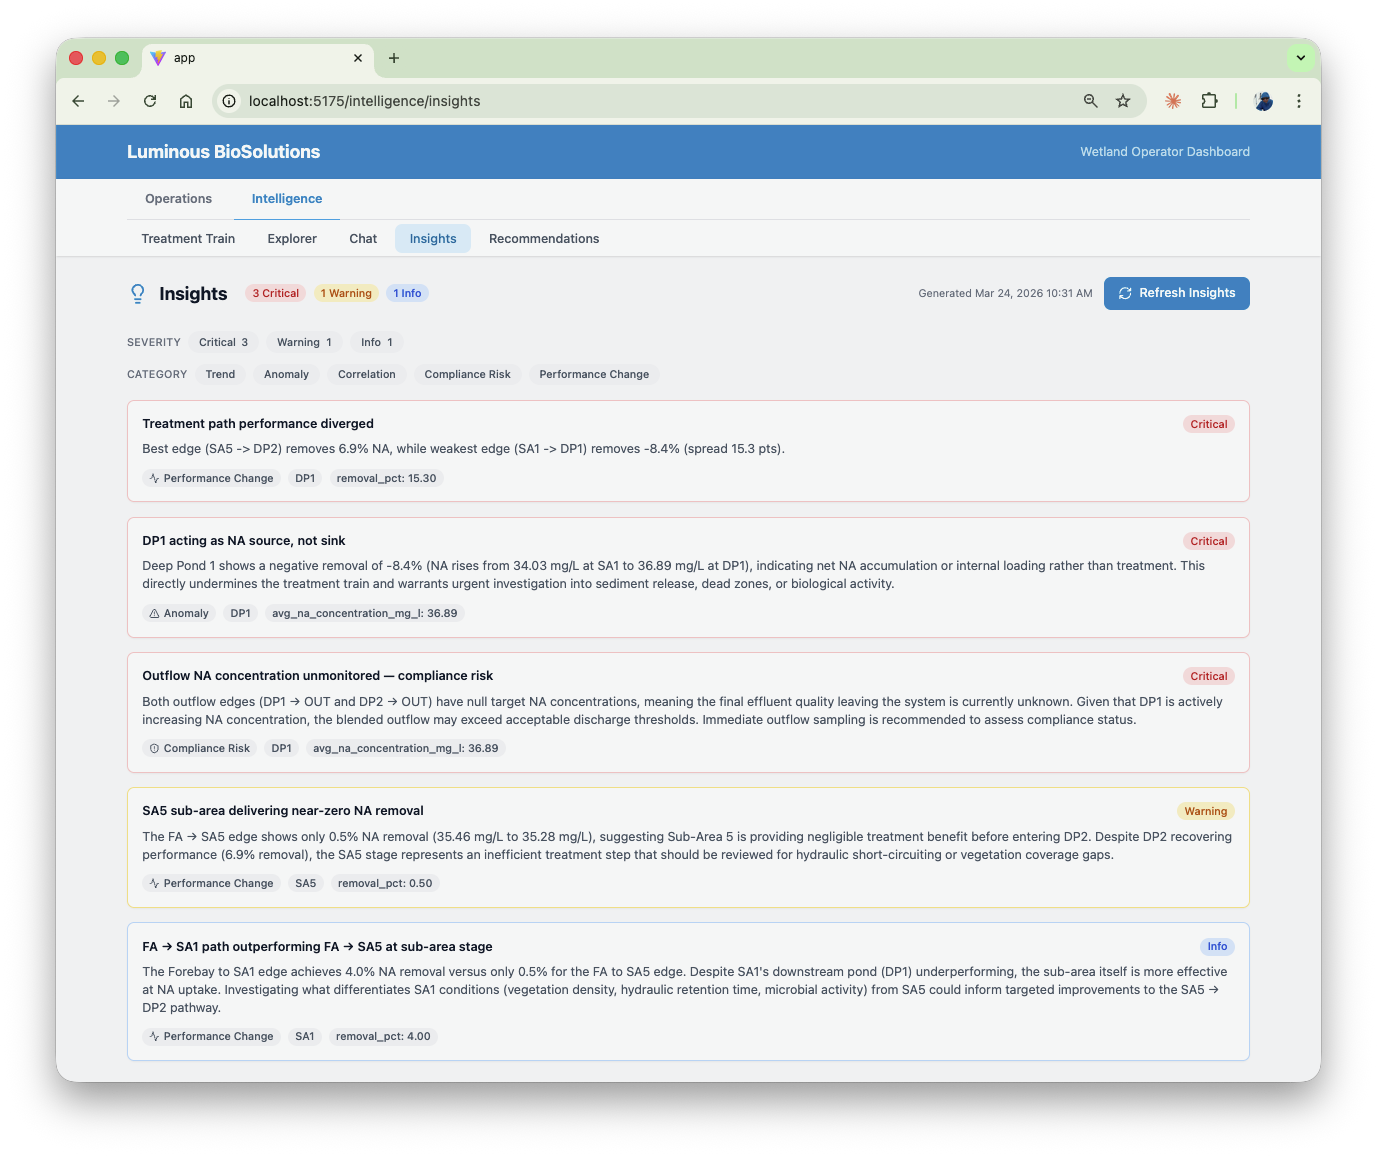
GCE insights view. Correlated variables across treatment systems.
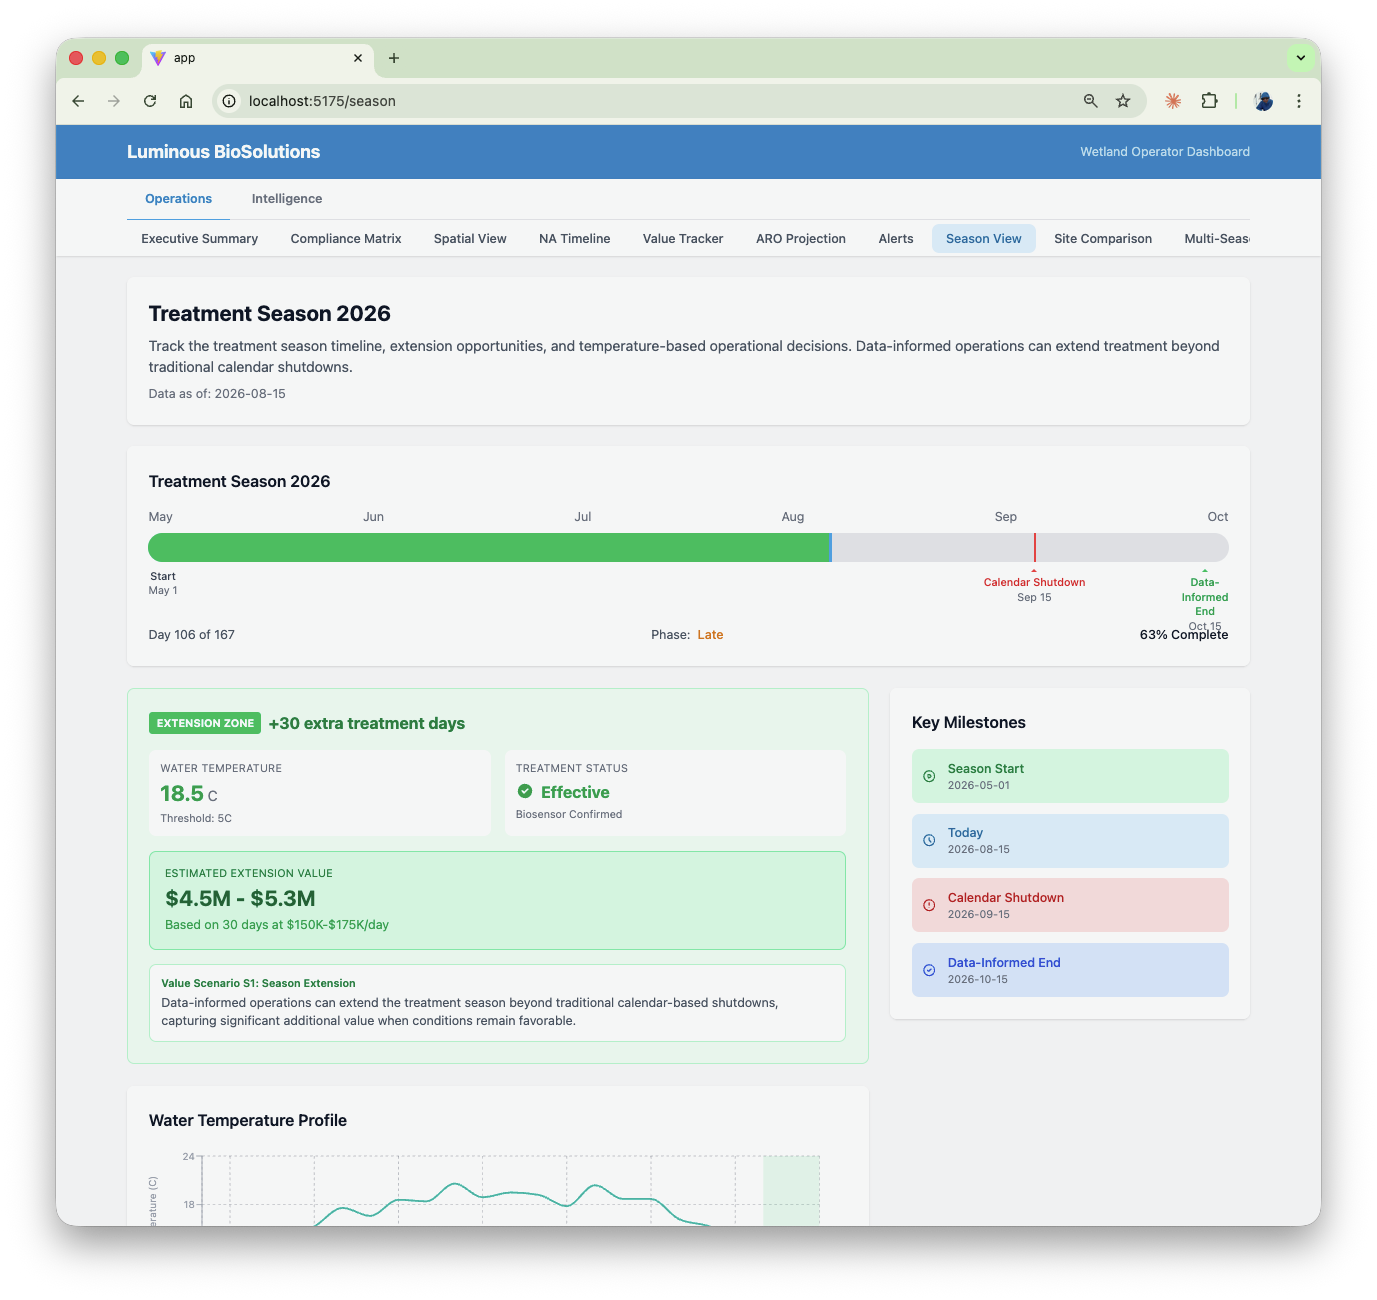
Season view. Treatment patterns over time. Not a mockup.
PANEL 4: ACTIVE AREA OF RESEARCH
The narcosis (direct toxicity) panel is in development and not currently available. When deployed, it will add a biological harm signal to the existing compound-class data, closing the gap between “what is present” and “what is causing damage.”
Performance Metrics
Lab technician operation. Field-ready accuracy and speed.
24-72 hrs
Biosensor Analysis Time
Sample receipt to classified compound-class data on the GCE dashboard.
2-30 mg/L
Detection Range
Aggregate detection limits dependent on NA mixture composition and environmental background.
96 samples
Per Plate
High-throughput format for rapid batch processing.
Lab Tech
Operation Level
No PhD required. Standard laboratory skills.
Graph-Based
GCE Architecture
Stores relationships between variables, not rows and columns. Correlations compound over seasons.
TRL 8
Technology Readiness
Biosensor + GCE validated in real-world oil sands treatment conditions.
Field Validation: Kearl GROW Wetland 2024-2025
Biosensor + GCE deployed alongside HRMS over a full treatment season.
Full treatment season at Imperial Oil’s Kearl GROW Engineered Wetland. High HRMS correlation across multiple samples and conditions. The biosensor showed early signals of changing NA composition that sparse HRMS sampling missed. The GCE connected those signals with operational variables to identify what was driving the changes.
Not just that something changed. What connects to it, across the system and across time.
Finding 1
Treatment Season Extension
Correlated biosensor and temperature data identified optimal treatment windows that periodic HRMS testing could not resolve.
Finding 2
Water Flow Routing
Correlated data surfaced performance differences between treatment cells, supporting routing decisions with evidence.
Finding 3
Reduced Confirmatory Testing
Continuous biosensor + GCE monitoring reduced the need for supplementary HRMS by providing reliable trend data between compliance samples.
Published Results
Peer-reviewed validation in ACS Synthetic Biology.
ACS Synthetic Biology
Construction of Whole Cell Bacterial Biosensors as an Alternative Environmental Monitoring Technology to Detect Naphthenic Acids in Oil Sands Process-Affected Water
Published September 2024
The paper details the design, validation, and field deployment of the three-panel biosensor architecture, including correlation with HRMS results from the Kearl GROW deployment.
Ready for a Technical Conversation
Schedule a briefing with Dr. Shawn Lewenza (biosensor science) and Greg Saunders (GCE architecture) to discuss the platform, the field data, and what becomes possible.