Oil Sands Water Monitoring

1.4 trillion litres of process-affected water.
No standardized way to measure
the thing that determines if it is safe.

Naphthenic acids are the primary toxicity concern in oil sands tailings water. In 2025, the Oil Sands Mining Water Steering Committee confirmed what operators already know: there is no standardized method for measuring them, no required monitoring frequency, and no way to compare results between laboratories.

Source: Oil Sands Mining Water Steering Committee, June 2025

Keep Reading
Scroll

Picture this.

You manage water at an oil sands operation in northern Alberta. Tailings ponds, pit lakes, treatment wetlands, process water streams. Your job is understanding what is in that water and whether treatment is working. It is September. You have maybe four weeks of warm weather left before biological processes slow down for winter.

You sent water samples to an HRMS lab eight weeks ago. The results just arrived. They show NA concentrations in one of your treatment systems never dropped the way they should have. The water you thought was progressing toward release has been underperforming all summer, and nobody saw it.

An entire season of treatment, and the data that would have flagged the problem arrives after the window to fix it has closed.

A result that arrives two months after the sample was collected tells you what happened. It does not tell you what to do next.

What if you could have seen it within 24 to 72 hours? And what if the data told you why it was happening?

The monitoring gap, in numbers

$12.3B

Suncor decommissioning obligations. Every year treatment progress cannot be demonstrated with data, these grow.

38-64%

Variability between HRMS laboratories testing the same water sample. The method is not standardized.

~$960M

Combined annual accretion across Suncor and CNRL. The cost of time without data.

Suncor 2024 Annual Report, Note 24, p.102. CNRL 2023 Annual Report, p.81.

What we built

A biosensor that measures what water does to living cells.
A data platform that tells you why.

The biosensor generates biological effect data at a frequency this industry has never had. The Graph Context Engine turns that data into operational intelligence by correlating it with everything else happening in your water system. One without the other is interesting. Together, they change how operators manage water treatment.

The Biosensor

A living measurement, built from the environment it measures.

HRMS breaks water samples apart and identifies molecular structures. It tells you what compounds are present. Our biosensor measures something different: biological effect. What naphthenic acids actually do to living organisms.

The bacteria in our biosensor are not engineered from scratch. They were isolated from Alberta tailings ponds. They evolved in the water this industry produces, and they respond to naphthenic acids the way organisms in that environment respond. That is not a design choice. It is why the biosensor works.

Three panels, each targeting a different class of naphthenic acids. Results in 24 to 72 hours. Lab technician operation, no PhD required. A fourth panel targeting direct toxicity through cell membrane damage is in development.

HRMS and the biosensor measure different things. Together, they give operators the chemical picture and the biological picture for the first time.

Luminous four-panel biosensor showing bioluminescent response to naphthenic acids

Living bacteria producing light proportional to NA concentration.

Not a rendering. An actual biosensor plate.

The Graph Context Engine

High-frequency data is only useful if you can correlate it.

A biosensor that produces results in 24 to 72 hours instead of 8 weeks generates a continuous stream of data. But volume alone is not the breakthrough. The breakthrough is correlation.

Oil sands operators already track dozens of variables: flow rates, chemical dosing, pH, temperature, seasonal patterns. That data sits in separate spreadsheets, PDF reports, and disconnected databases. When NA levels change, there is no practical way to ask what else changed at the same time.

A traditional database stores rows and columns. The Graph Context Engine stores relationships. When the biosensor flags a shift in NA levels, the GCE can show you that flow rates changed two days earlier, that pH dropped in the upstream system, and that the same pattern occurred last September. The relationships between variables are the insight.

The biosensor sees what is happening. The GCE shows you why, and what to look at next.

Graph Context Engine executive summary showing correlated monitoring data across treatment cells

Executive summary view. This is not a mockup.

Graph Context Engine spatial view showing treatment cell performance across a wetland site

Spatial view. Every treatment cell. Every variable. Connected.

NA degradation timeline showing compound-class trends correlated with operational variables

NA degradation timeline. Compound-class trends correlated with operational variables over a full treatment season.

Built in Alberta

This technology was not imported. It was built here, for this problem, by the people who understand it.

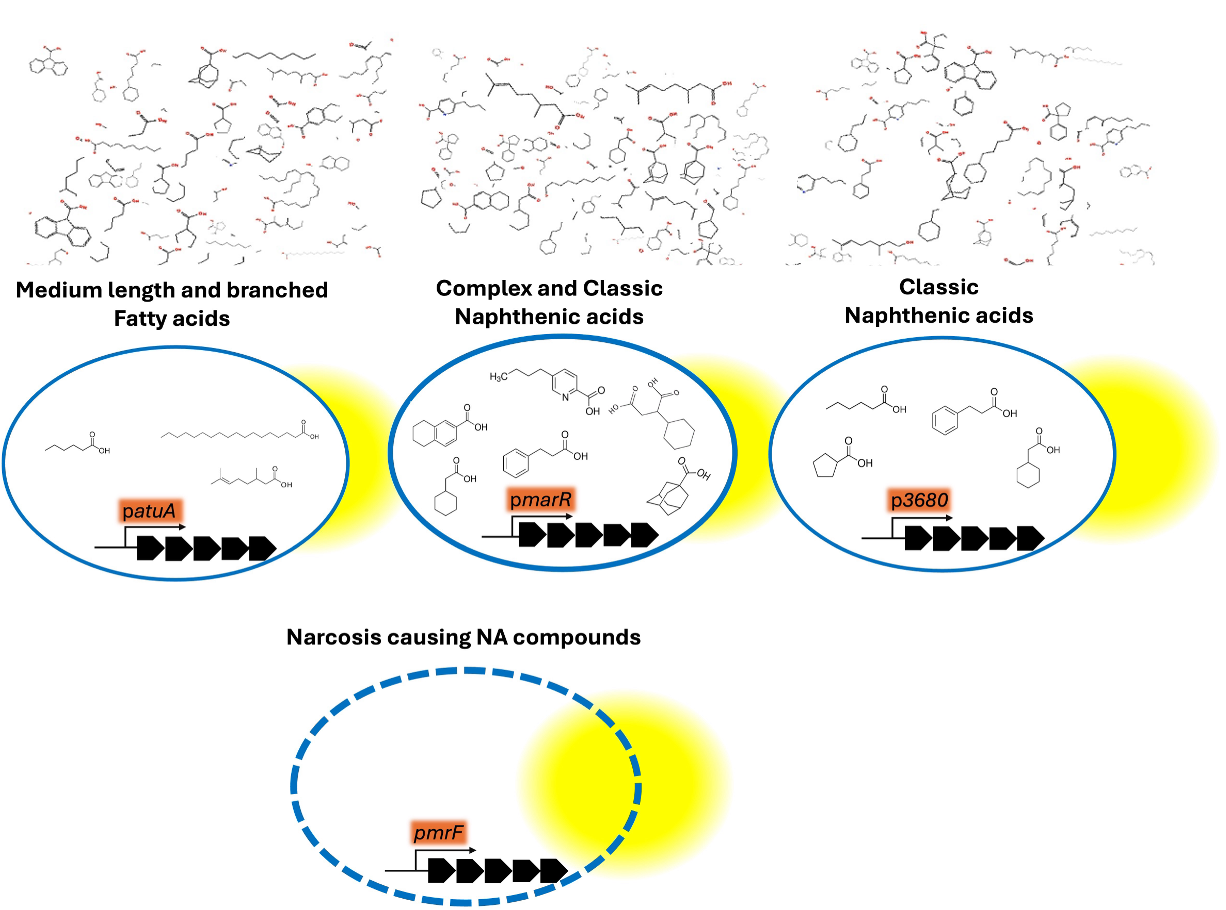
The bacteria were isolated from Alberta tailings ponds. The biosensor was invented at the University of Alberta and validated at a working oil sands wetland. The Graph Context Engine was built specifically for the data relationships that exist in oil sands water treatment. The team is based in Calgary. This is not a Silicon Valley startup adapting general-purpose tech to a problem it read about. This is Alberta science solving an Alberta problem.

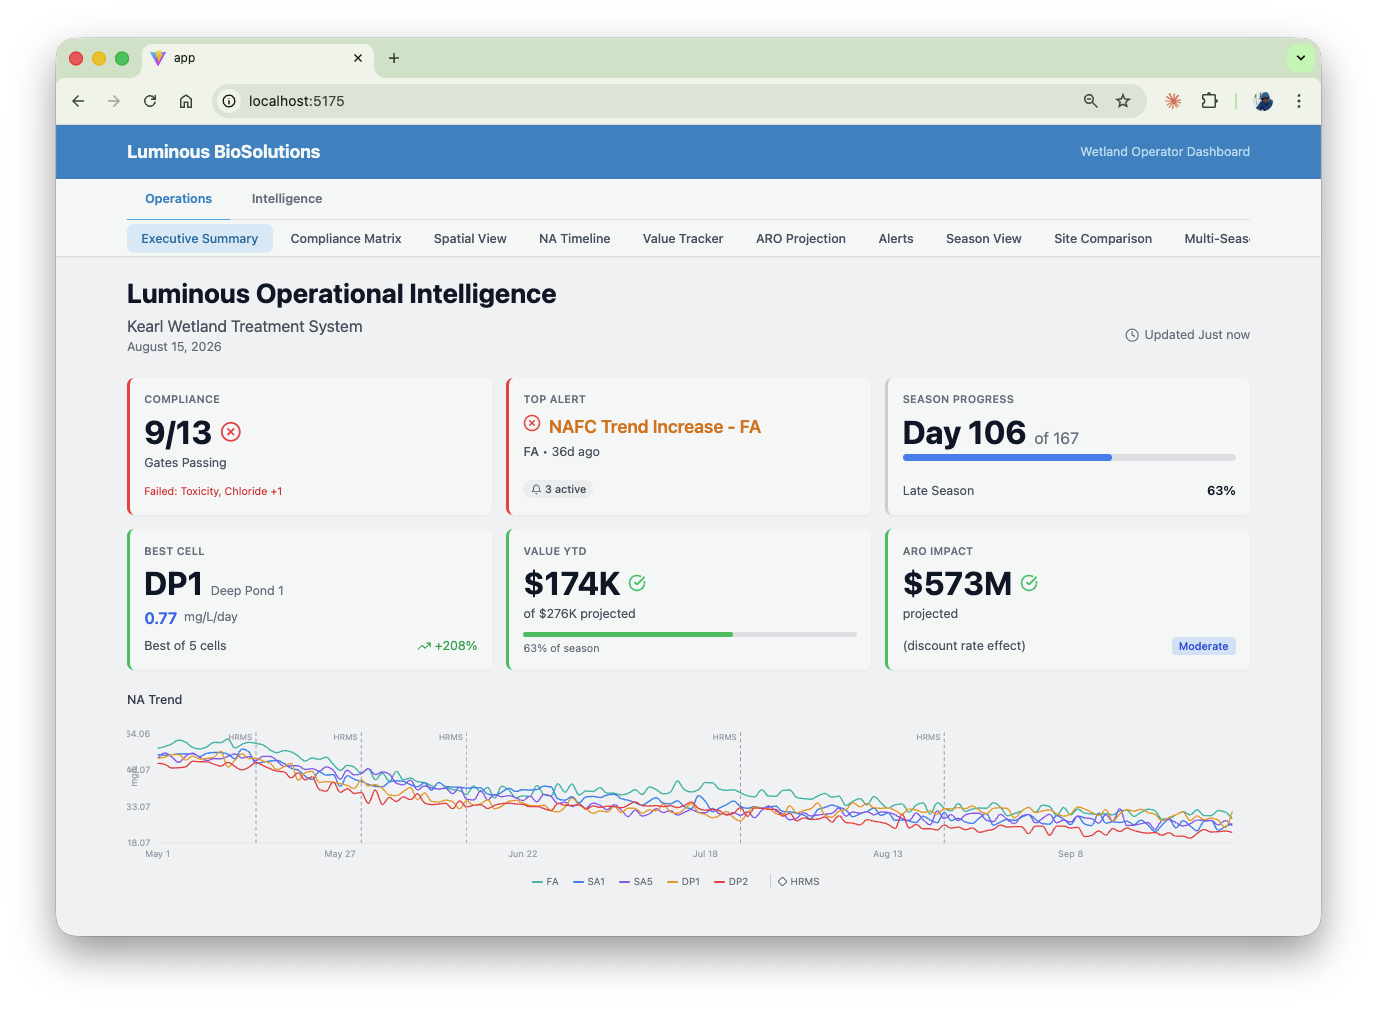
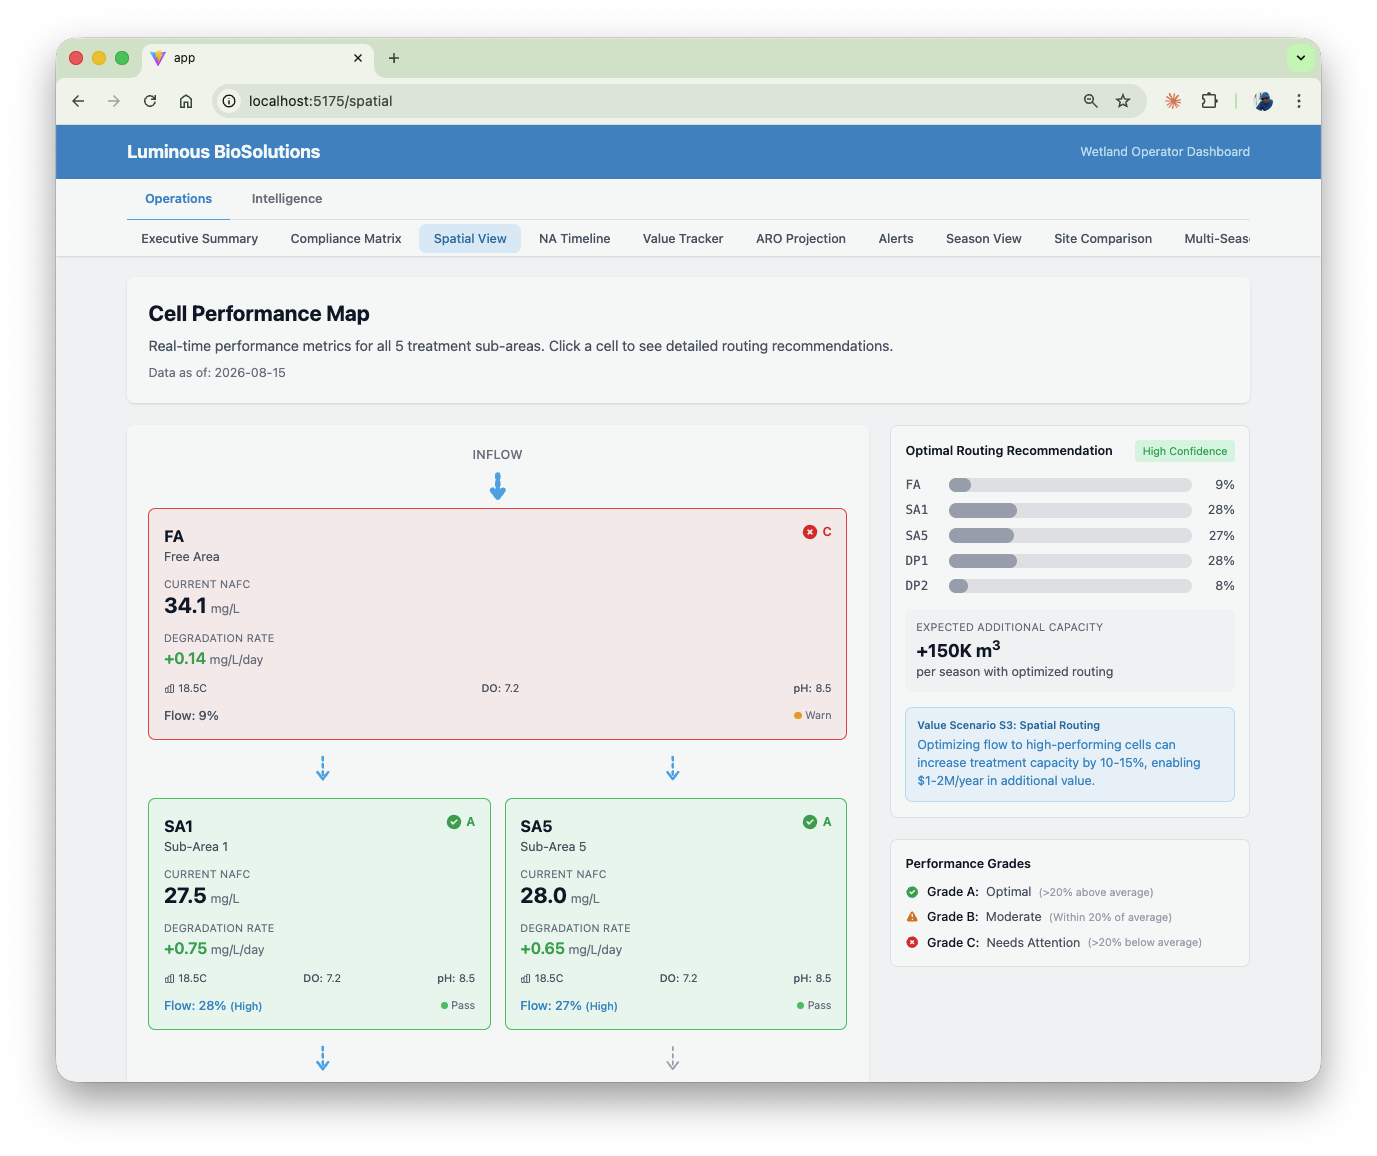
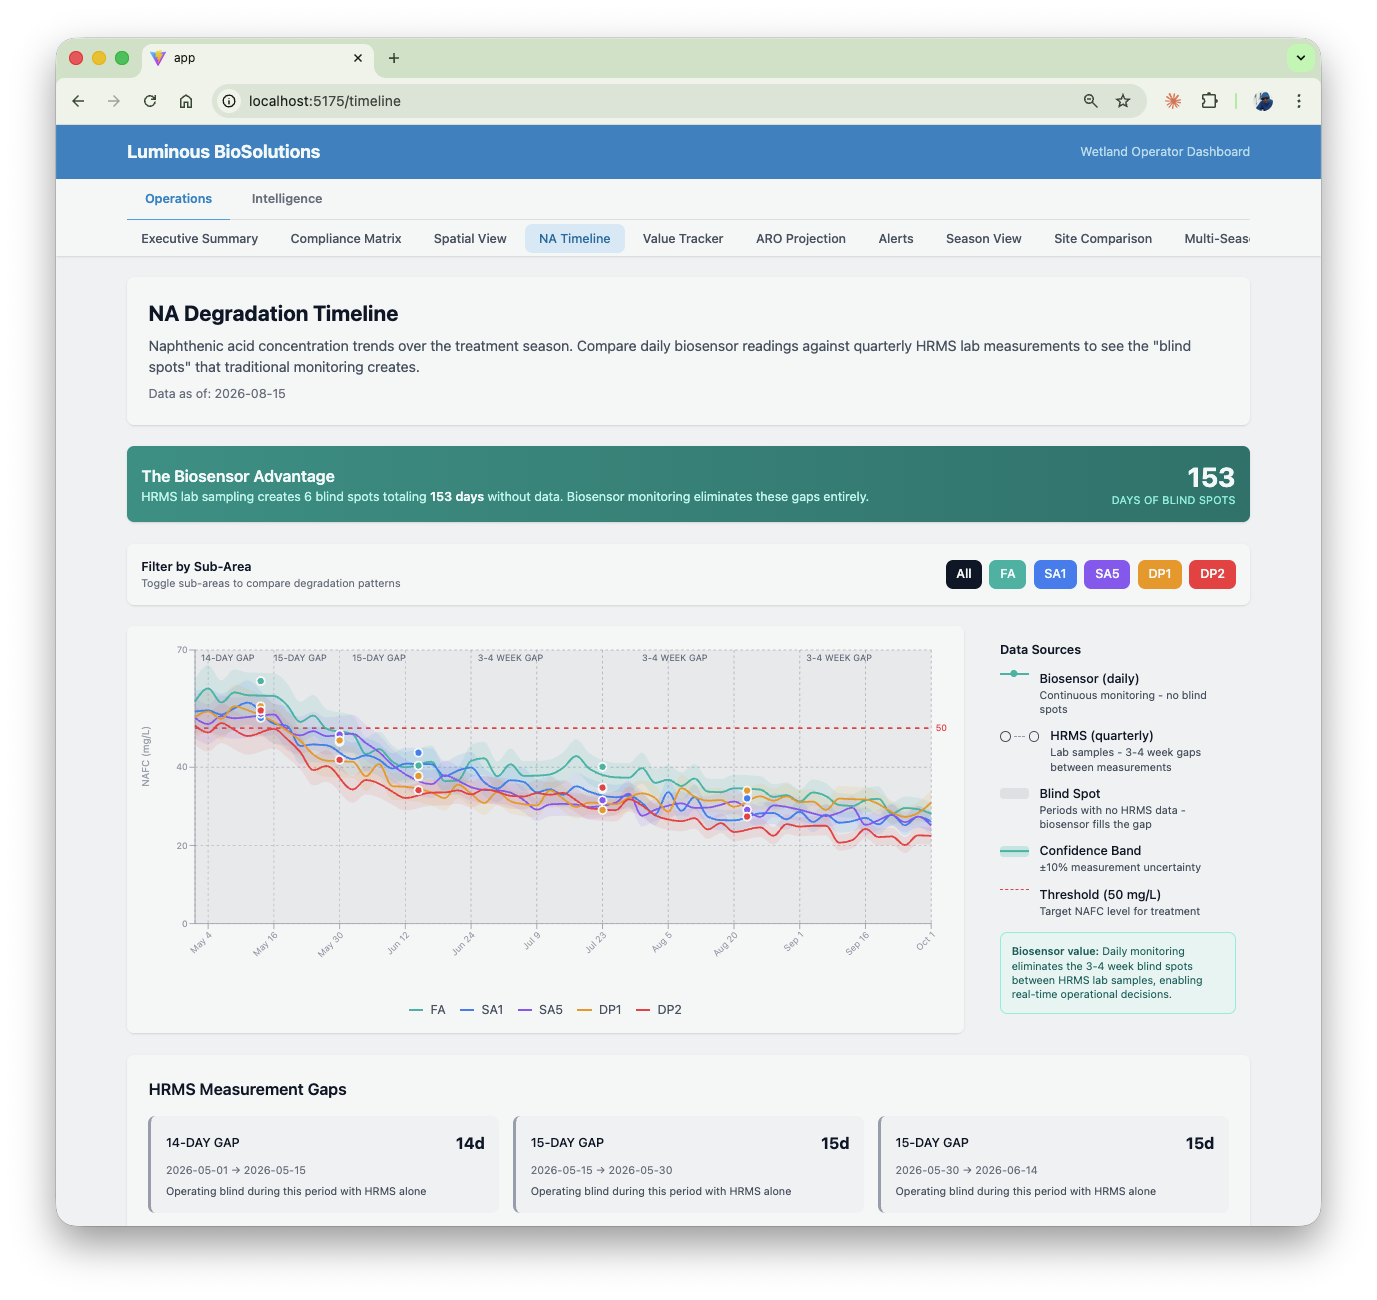
What we are building is not just a product for operators. Operators get operational visibility. Regulators get a defensible, continuous data stream. And Indigenous communities and downstream stakeholders, who have been asking legitimate questions about water quality for years, get access to the same monitoring data. Not a summary. Not a quarterly report. The same data, at the same frequency.

We do not presume to define what trust looks like for those communities. That is not our place. But we believe that transparent, continuous, independently verifiable monitoring data is part of how trust gets built. And we believe the technology to make that possible should exist.

That alignment between operators, regulators, and communities is not an accident. It is the whole point.

Why you should believe this

Field-validated. Peer-reviewed. Patent-pending.

We do not ask you to take our word for it.

Kearl GROW Engineered Wetland

Field-validated alongside HRMS at Imperial Oil’s Kearl site over a full treatment season. High correlation with HRMS results. The data showed treatment performance issues weeks before periodic HRMS testing would have caught them.

Published in ACS Synthetic Biology

Peer-reviewed and published in September 2024. Not proprietary claims. Independently verified research in a world-leading journal.

Technology Readiness Level 8

Not a lab prototype. Field-validated in real operational conditions with real oil sands process-affected water. The biosensor works because it was built from the same environment it measures.

Built by the Scientists Who Invented It

Dr. Shawn Lewenza invented the biosensor at the University of Alberta. Greg Saunders built the Graph Context Engine. The team is not commercializing someone else’s research. The inventors are building the company.

Ship us your samples. We do the rest.

No capital investment. No IT integration. No disruption to your operation. Subscription model: fixed cost, unlimited testing. The more you test, the smarter the system gets, because every data point strengthens the correlations.

Ship Samples

Operations teams ship water samples to the Luminous lab in Calgary.

24-72 Hours

Three biosensor panels classify NAs by compound type. Lab technician operation, standard equipment.

Live Dashboard

Results appear on the GCE dashboard. Not in a PDF sitting in someone’s inbox.

Correlated Intelligence

The GCE maps NA data against your operational variables. You see what changed, what it connects to, and what to look at next.

The monitoring infrastructure this industry needs does not exist yet.
We are building it. In Alberta. For Alberta.

45 to 60 minutes with Dr. Shawn Lewenza (biosensor science) and Greg Saunders (GCE architecture). We will walk through the field validation data, show you the platform, and answer your questions directly.

Schedule a Briefing

Or reach out directly: jeff.violo@luminousbiosolutions.com | 403-813-8529